WEEKLY MARKET & ECONOMIC COMMENTARY
Week Ending Oct 30th, 2026
Market Recap
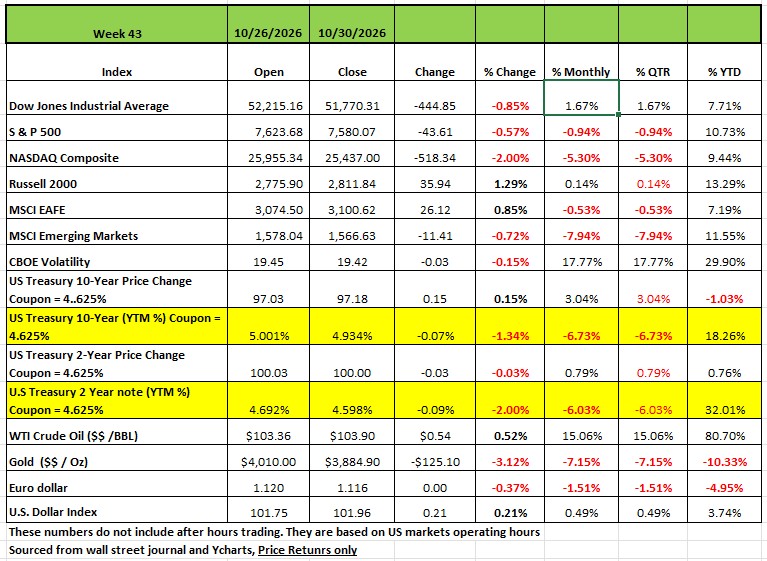
The Russell 2000 was the only index to post a positive return last week with a +1.2% gain. The S&P 500 index edged -0.6% lower last week after quarterly results from hyper-scalers disappointed investors The DJIA posted a -0.85% decline and the NASDAQ a whopping -2%, which also declined 5.3% on the month.
While many companies posted increase in revenue or earnings markets are becoming more weary of the cost involved.
Anthropic on Monday filed with the US Securities and Exchange Commission for an initial public offering of Class A common stock on the Nasdaq Global Select Market under the ticker symbol "ANT."
The Federal Open Market Committee kept interest rates steady and said it needs more information before it can consider making a policy change. The core personal consumption expenditures price index, the Fed's preferred inflation measure, grew in line with expectations in September.
Economic data due includes the ISM manufacturing and services purchasing managers' indexes, the job openings and labor turnover survey, nonfarm payrolls and Michigan consumer sentiment and inflation expectations.
Treasury yields dropped moderately over the course of the week on a Fed rate decision and a sell-off of AI-related companies. Yields rose slightly during the 1st half of the week as the results of the Federal Reserve Bank meeting on Wednesday weighed on investors. On Wednesday, the Fed kept the Federal Funds Rate steady at 4.00%, as expected, but did not give any clear signals as to whether the Fed would increase rates in the near future. In the press conference, Fed Chairman Kevin Warsh brought up several factors pointing to stronger economic activity. On Thursday and Friday, disappointing results from several AI-related companies caused equities to drop significantly and investors to seek the perceived safety of Treasurys, causing yields to drop moderately to end the week. The market implied probability of an increase to the Federal Funds Rate at the December 9th meeting dropped slightly from 75% to 73% over the course of the week while the market implied rate for June 2027 dropped from 4.50 to 4.43, implying that the Fed may not raise rates as aggressively as previously expected.
By Sector
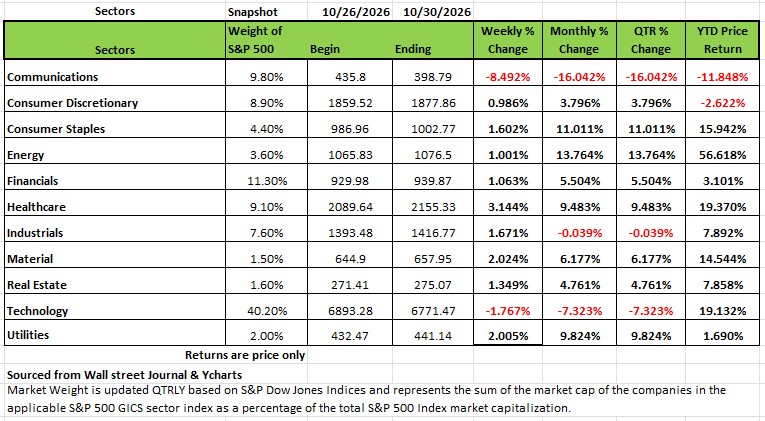
The healthcare sector in the S&P 500 had the largest percentage gain of the week, up +3.1%, followed by a gain of about +2% each in materials and utilities.
Eli Lilly's (LLY) shares jumped 11% after the healthcare giant reported a year-over-year jump in Q3 non-GAAP earnings and revenue and raised its full-year 2026 revenue outlook.
International Paper (IP) reported a stronger-than-expected swing to adjusted operating earnings in Q3, from a loss a year ago. Its shares closed up +9.6%.
The S&P 500's two declining sectors this week were communication services and information technology, down -8.5% and -1.8%, respectively.
Alphabet's (GOOG, GOOGL) Q3 earnings unexpectedly declined with sales lagging as artificial-intelligence-led summaries used in search undermined Google's revenue. Class A shares fell almost 13% and class C shares declined 12%. Reddit (RDDT) shares sank -36% after the company reported Q3 earnings that missed analyst expectations. Goldman Sachs slashed its price target on the company to $140 from $215, among several firms to adjust forecasts.
Companies reporting quarterly results next week include Apple (AAPL), Palantir Technologies (PLTR), Advanced Micro Devices (AMD), Arista Networks (ANET), Arm (ARM), Qualcomm (QCOM), Uber (UBER), ConocoPhillips (COP), Monster Beverage (MNST) and Cloudflare (NET).
The $5 Trillion Correction Hiding Inside a Calm Index
AI stocks just went through a bear-market-sized drawdown. The S&P 500 barely noticed. Here is why that matters for how you are invested.
If you only checked the S&P 500 last week, you would have concluded that nothing much happened. The index slipped about 0.6%. That is a rounding error in a year when it is still up roughly 11%.
Look one layer down, and a very different picture appears. By Yahoo Finance's tally, the largest AI and semiconductor stocks have shed about $5 trillion in market value since October 6. Over the same stretch, the other 625 large U.S. companies in that count gained about $1.3 trillion. Last week, nine of the S&P 500's eleven sectors rose roughly 1% or more, while the index as a whole went down.
In other words, we did not have a quiet market. We had two markets moving in opposite directions, and the index averaged them into something that looked calm. That gap between what the headline number says and what is actually happening in portfolios is this week's subject.
Two Markets, One Index
The numbers from October tell the story clearly. The technology-heavy Nasdaq Composite lost about 5.2%, its worst month since March 2025. The S&P 500 fell less than 1%. The Dow Jones Industrial Average, which is weighted toward older, cash-generating industrial and consumer companies, actually rose about 1.7%.
The semiconductor index is now about 29% below its recent high. That is a full bear market by any standard definition. Alphabet and Meta are both more than 20% off their peaks. Alphabet alone lost roughly half a trillion dollars of value in a single session last Thursday, and it closed out its worst month on record.
Meanwhile, money did not leave the stock market. It moved. Consumer staples, health care, and steady compounders like Procter & Gamble and Berkshire Hathaway caught the flows. That is a rotation, not a panic.
The index didn’t tell you what happened. It averaged it away.
What Triggered It: The Market Started Reading the Cash Ledger
Last week we wrote about the gap between Big Tech's AI spending and its free cash flow. Free cash flow is the cash a business has left after paying for its operations and its investments. We argued that the market would eventually stop rewarding AI spending on promise and start judging it on cash. The earnings reports that followed show that this has started to happen.
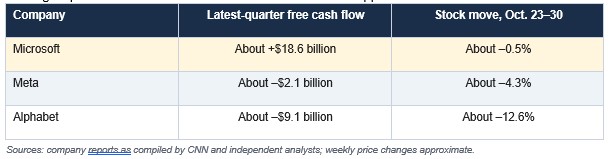
Microsoft, the one large AI spender still generating strongly positive free cash flow, barely moved. Alphabet reported negative free cash flow for a second straight quarter, which had never happened before, along with softer search-advertising results. It was punished hardest. On Friday, Intel's weak guidance and warning about cash burn spread the selling across the entire chip complex, with Intel itself falling more than 25% in one day.
Here's why this matters: the market is no longer treating every company with AI exposure the same way. It is sorting companies by who can pay for the build-out and who cannot. That is a healthier market than one that bids up everything with "AI" in the press release.
Two more pressures make this sorting sharper. First is the sheer size of the spending. According to Capital Economics, Microsoft, Meta, Amazon, and Alphabet together accounted for more than one-third of all capital spending by S&P 500 companies over the past twelve months. Their combined 2026 spending plans now exceed $740 billion. Second, more of that spending is being financed with debt, and debt is getting more expensive. The Fed raised rates in September for the first time in three years, and markets are pricing a high probability of another hike in December. Every increase in borrowing costs raises the return an AI project has to earn before it pays for itself.
Why the Index Hid It: Concentration
The S&P 500 is weighted by market value, so the biggest companies move it the most. When a handful of companies make up an unusually large share of the index, the index stops measuring "the market" and starts measuring those companies.
That cuts both ways. On the way up, concentration made the index look stronger than the typical stock. This fall, it made the index look calmer than the typical AI holding. In both cases, the headline number misrepresented the experience of the average investor.
A simple illustration makes the point. Imagine an index where one group of stocks is 35% of the weight and the other 65% is everything else. If the first group falls 10% and everything else rises 3%, the index loses only about 1.6%. Someone holding mostly the first group is down 10%. Someone holding mostly the rest is up 3%. The index reports neither of their experiences.
This is why we have never accepted the idea that owning a cap-weighted index fund equals being diversified. You can own 500 names and still have your results driven by a few of them. Real diversification is about what drives your returns, not how many tickers you hold.
What This Means for Investors
Look under the hood of your "diversified" holdings. If your core equity exposure is a broad index fund plus a growth fund plus a technology fund, you may own the same handful of AI names three times over. Last month is a good stress test. If your portfolio fell much more than the S&P 500, concentration is the likely reason.
Cash flow is back in charge. The market just showed us that companies funding growth from internal cash are being treated very differently from companies that need outside capital. That is a valuation discipline we apply to every position, and the market is now enforcing it too.
A rotation is not the end of the AI story. The underlying demand is real. Alphabet, Microsoft, and Amazon report backlogs of roughly $1.7 trillion against up to about $600 billion of 2026 spending. If that spending turns into cloud revenue faster than expected, last week's winners and losers could change places within a quarter. The question is not whether AI matters. The question is what price is worth paying for it.
Be careful what you run to. When investors flee one crowded trade, they often pile into another one. This fall, the main beneficiary has been Apple. That deserves a closer look, below.
A Closing Word on Tuesday's Midterm Elections
We don't make political calls in this newsletter, and we won't start now. But clients reasonably ask whether an election should change how they are invested, so here is what the record shows over the past fifty years. The table below lists the S&P 500's price return over the twelve months after each midterm election since 1978.
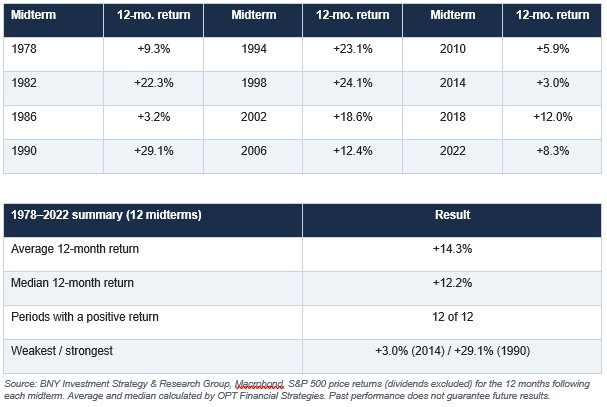
Over the last fifty years, the market has been higher a year after every midterm election, regardless of which party won. The usual explanation has nothing to do with politics: it is uncertainty. Markets tend to struggle in the months before a midterm and recover once the outcome is known. U.S. Bank's longer history shows weaker-than-average returns in the year leading into midterms, followed by stronger returns afterward.
Two cautions keep this in perspective. First, twelve observations is a small sample, and history does not guarantee results. The 1986 period stayed positive even though it included the October 1987 crash, which shows how much can happen inside a "good" year. Second, the conditions entering this election matter more than the calendar. We have a Fed that is raising rates, oil above $100, and the AI repricing described above. Those forces will drive markets far more than the vote count. Our advice is the same every cycle: vote your conscience and invest according to your plan.
The Bottom Line
October's real story was a $5 trillion repricing inside a group of stocks that dominates the index. The index's calm surface hid it. The lessons are the same ones we keep coming back to: know what actually drives your returns, judge companies by the cash they generate, and don't confuse a famous name with a safe price.
SideBar
What Are You Paying for Safety? Apple at $5 Trillion
As AI stocks fell, Apple became the market's preferred hiding place. It closed Friday worth about $5.03 trillion, which once again makes it the most valuable company in the world, ahead of Nvidia at about $4.93 trillion. It is the only "Magnificent Seven" stock beating the S&P 500 this year, up about 27% against roughly 11% for the index.
Apple is a high-quality business. But a safe company is not the same thing as a safe price. In valuation terms, the question is how much investors are paying for each dollar of earnings.
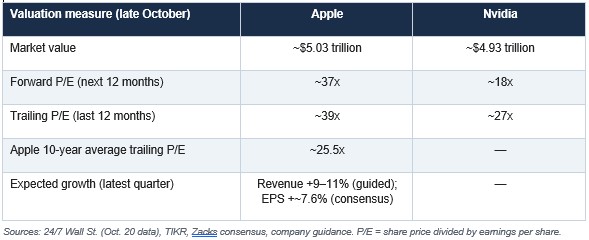
Investors are currently paying about twice as much for each dollar of Apple's expected earnings as for Nvidia's, while Apple's business is growing at a high-single-digit to low-double-digit pace. There is also a simpler way to frame the price. At about 37 times forward earnings, Apple's earnings yield, which is earnings divided by price, works out to roughly 2.7%. The Federal Reserve's effective policy rate is about 3.9%, so a money market fund currently pays more in cash yield than Apple earns per dollar of share price.
The premium is a payment for stability: a loyal customer base, a large services business, and enormous buybacks. That stability is real. But a stock trading about 50% above its own ten-year average multiple has little room for disappointment. Apple's margins are already being squeezed by rising memory-chip costs and supply constraints.
Apple reports results after the close on Monday. Whatever the quarter shows, our point stands: moving from an expensive AI stock to an expensive defensive stock is not risk reduction. It is a different risk.
The Week Ahead
The U.S. congressional elections are likely to command the greatest attention over this consequential week. The elections will offer an important signal, indicating whether the current administration will face a shift in the political landscape that could prevent it from advancing its agenda over the next two years. The immediate market implications may depend not only on the election results themselves, but also on how investors interpret the potential path for policy and the extent to which the outcome changes expectations for the balance of power in Washington. Alongside the election, earnings from Apple, AMD, Palantir and Super Micro Computer should provide additional perspective on the durability and breadth of the technology and artificial-intelligence trade. These companies’ aggregate performance could help investors assess the degree to which AI enthusiasm is becoming more differentiated as various companies’ earnings diverge. By the end of the week, attention should shift toward the health of the U.S. consumer, with Friday’s unemployment-rate, hourly-earnings and consumer-credit readings helping to clarify how well households are navigating persistent inflation and broader economic pressures. If the labor market and wages remain strong, observers may conclude that consumers can still absorb these pressures, while weakness in employment or credit markets could indicate the opposite. The latter scenario could also imply that effects could extend beyond the consumer and impact growth expectations for business that are highly exposed to household spending. The week could therefore provide investors with a more complete picture of three important variables shaping the market outlook: the direction of U.S. policy, the underlying strength of the technology and AI trade, and the durability of the consumer.
#FinancialAdvisor, #investmentmanagement #wealthmanagement #financialplanning #retirementplanning #401kplans
Important Disclosures
This commentary is provided by Optimized Capital for informational and educational purposes only and does not constitute investment, tax, or legal advice, or a recommendation to buy or sell any security. Opinions expressed are as of the date of publication and are subject to change without notice. Information has been obtained from sources believed to be reliable, but its accuracy and completeness are not guaranteed. Valuation figures are approximate and may change materially following the earnings reports discussed. Past performance is not indicative of future results. All investing involves risk, including the possible loss of principal. Please consult your advisor regarding your individual circumstances.