WEEKLY MARKET & ECONOMIC COMMENTARY
Week Ending September 25th, 2026
Market Recap
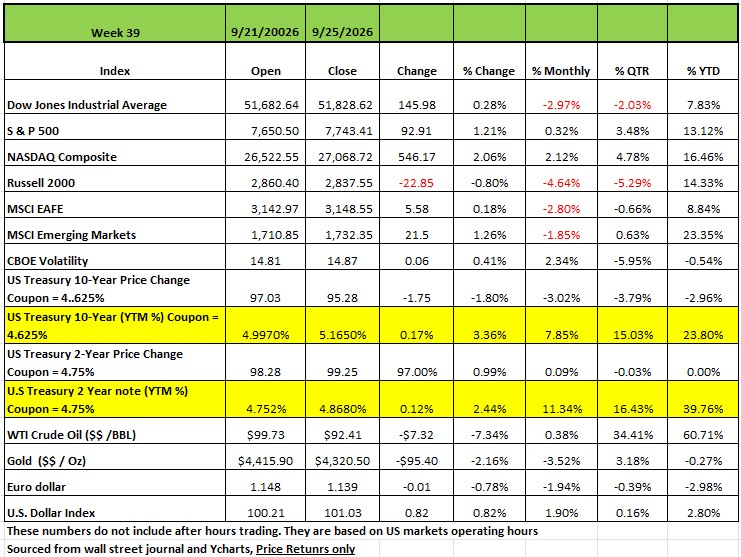
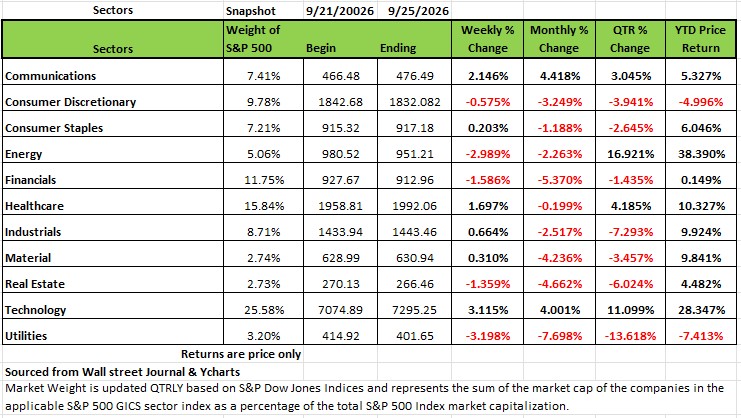
Three of the four indices posted positive returns on the week ending September 25, with the Russell 200 being the only decline -0.80%. The NASDAQ returned to 2.06% followed by the S&P 500 with a 1.2% increase and the DJIA with a +0.28% return. The technology and communication services sectors led the S&P.
With just a few sessions remaining in the month, it will be interesting to see how the month of September ends as well as Q3. So far, the DJIA and the Russell are both negative for the month and for Q3. However, YTD all the indices are in positive territory.
Data released Friday showed US consumer sentiment in September reached its lowest level in four months as inflation expectations rose, according to a University of Michigan survey. While the main sentiment index fell -7% sequentially to 48.1 this month, it was higher than the preliminary result of 47.8. It also surpassed expectations for a reading of 47.5, according to a survey compiled by Bloomberg.
In geopolitical news, Iranian Foreign Minister Abbas Araghchi said Tehran is willing to reopen the Strait of Hormuz, a key crude and energy chokepoint, and restart talks on its nuclear program if Washington accepts its conditions, Iran foreign minister Araghchi's remarked on the sidelines of the United Nations General Assembly. We are not so sure that Washington will accept their conditions if it includes access to nuclear material.
President Trump described his meeting with Chinese leader Xi Jinping at the White House as "very productive" for both nations. Washington and Beijing have agreed to extend their trade truce by two months into January 2027.
The bond selloff continued last week, with the 5-year US Treasury yield climbing above 5% for the first time since 2007. Yields rose (Prices dropped) following Wednesday’s release of the S&P Global US Composite PMI, which is a survey of both services and manufacturing firms. The survey easily beat estimates, showing robust US business activity in September that increased at the fastest pace in over five years. The survey also showed a sharp rise in employment to meet higher demand, as well as higher input costs due to spiking energy prices. Hawkish comments from the Fed and a defiant speech from Iran’s president at the UN General Assembly also contributed to the rise in yields. The selloff continued Thursday as US long-dated bond yields climbed to their highest levels in more than two decades, with the 30-year US Treasury yield climbing to 5.44%, the highest level since 2004.
By Sector
Six of the 11 S&P 500 sectors finished higher last week. Technology led with a +3.1% gain, followed by communication services at +2.15%. Healthcare rose +1.7%, while industrials, materials, and consumer staples posted modest gains. Everpure (P) was the top performer in the technology sector, jumping +21% on the week. The company reaffirmed its fiscal 2027 guidance for adjusted operating income and revenue and issued fiscal 2028 guidance above analysts' expectations. Facebook parent Meta Platforms (META) led the advance in communication services, climbing +13% amid excitement around its Muse artificial intelligence agent. Meta also unveiled plans to release its new Meta VR Glasses in spring 2027 for $1,299.99 and expand its artificial intelligence eyewear lineup.
On the downside, utilities fell -3.2%, followed by a -3% decline in energy, a -1.6% loss in financials and a -1.4% slip in real estate. Consumer discretionary also edged lower by half a percent. PG&E (PCG) had the largest percentage drop in utilities, falling -6.5%, as UBS downgraded its investment rating on the stock to neutral from buy. UBS also cut its price target on PG&E's stock to $14 per share from $19.
Earnings reports this week, which include the final three trading days of the month and quarter, are expected from companies including Micron Technology (MU), Accenture (ACN), Nike (NKE), McCormick (MKC), Jabil (JBL), Carnival (CCL) and CarMax (KMX).
Economic data will feature the government's September payrolls report, due Friday. Other data will include August personal consumption expenditures and the third estimate of Q2 gross domestic product.
National Debt:
5.23% and Climbing:
The Bond Market Just Sent Washington the Bill
Why long-term rates are at 19-year highs, why the 1990s playbook won’t work this time, and four ways this could play out for investors.
The 10-year Treasury yield hit 5.24% today — its highest level since the summer of 2007. The 30-year bond pushed past 5.5%, a level we haven’t seen since 2004. If you have a mortgage, a business line of credit, or a bond portfolio, you are already feeling it.
Most of the commentary you’ll read blames one of two things: the Federal Reserve or inflation. Both are part of the story. But both are symptoms. The issue is bad decision-making for too long and a federal government that has borrowed so much for so long that the bond market is finally charging for it, and the cost reflects what the market thinks the risk is actually worth.
Three Reasons Rates Are Here — and The One Thread That Ties Them Together
1. The Fed has stopped holding rates down. It's been 18 years since the Great Financial Crisis (GFC). For more than a decade afterward, the Federal Reserve kept long-term rates artificially low by buying trillions of dollars in Treasury bonds, a policy known as quantitative easing (QE). Cheap money had a side effect: Washington borrowed as if it would never end. Congress never formally adopted Modern Monetary Theory, the idea that a government printing its own currency can borrow without consequence, but it certainly spent like it had. Eventually, the bill comes due, and it's starting to arrive. Chairman Kevin Warsh raised rates again on September 16 and has made clear he wants short-term rates, not bond buying, to be the Fed's main tool. At the same time, the Treasury Department has been buying back long-term bonds to keep a lid on yields. When the Fed and the Treasury are pulling in opposite directions, the market notices
2. Inflation fear is back. The Fed’s own projections now show inflation (PCE) finishing in 2026 near 3.7% — well above its 2% target. Investors who lend money for 10 or 30 years want to be paid for the risk that the dollars they get back will buy less. For those unfamiliar with the math a $1000 loan today only has purchasing power of $963 a year from now.
3. Supply. The Treasury has to sell an enormous amount of debt every single week, and buyers are getting pickier. Last week’s 5-year note auction came in far weaker than expected. When a borrower keeps coming back to the window, lenders start raising the price. Here is the thread: the Fed can’t keep rates low without reigniting inflation, and inflation is harder to fight when the government is running trillion-dollar-plus deficits in a healthy economy. All three roads lead back to the national debt $40 plus trillion.
Fiscal Year 2026 (ends September 30) Net interest on the national debt $1 trillion dollars or 3.3% of GDP — the highest since at least World War II. More than the U.S. spends on its military
First, Some Perspective: 5% Isn’t High. It’s Normal
Before we go any further, one thing needs to be said clearly, because you won’t hear it on the news: a 10-year Treasury yield around 5% is not an emergency. By historical standards, it’s ordinary.
Since the early 1960s, the 10-year yield has averaged somewhere around 6%. Through most of the 1990s — one of the best decades for stocks and for the economy in American history — it sat between 5% and 8%. In the years just before the 2008 financial crisis, 4.5% to 5% was simply what money cost
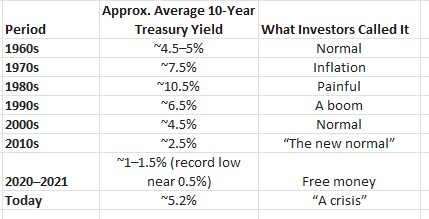
What changed wasn’t the rate. What changed was us. After the 2008 crisis, the Fed held short-term rates near zero for the better part of a decade and bought trillions of dollars of bonds to hold long-term rates down. Then it did it again in 2020. An entire generation of investors, homebuyers, and business owners — and frankly, a lot of financial professionals — never experienced “normal.” We were conditioned to believe 3% mortgages and 2% Treasury yields were the natural state of things. They weren’t. They were the emergency setting, left on for more than ten years.
Behavioral economists have a name for this: anchoring. We judge what’s “high” or “low” by what we’re used to, not by what’s typical. Someone who bought a home at 3% sees a 7% mortgage as outrageous. Their parents, who bought in the 1980s at 12% or more, see it as a bargain. Neither one is being irrational — they’re just anchored to different starting points. The long-run average 30-year mortgage rate is roughly 7.5%.
The media doesn’t help. “Yields hit highest level since 2007” is accurate, and it’s also designed to make your stomach drop. A headline that says “Bond yields return to their long-run average” doesn’t get clicks. Fear sells, and every basis point gets covered like a five-alarm fire. That creates anxiety that doesn’t match reality — and anxious investors make expensive decisions.
So let us be precise about what we are and are not worried about. We are not worried that 5% is too high. We are worried about what normal interest rates do to an abnormal amount of debt. The federal government borrowed as if the emergency setting would last forever. It didn’t. That’s the real story — and it’s the one worth understanding.
Net Interest payments on the U.S Debt is $1 Trillion Dollars Fiscal Year 2026 (which ends tomorrow 9/30/2026) is 3.3% of GDP this is the highest since WWI and is more than the U.S spends on its Military
We’ve Been Here Before — Sort Of
Interest costs this high relative to the economy aren’t completely unprecedented. In the late 1980s and early 1990s, net interest ran close to today’s level. And yet, interest rates spent that entire period falling. How?
Because the country had a credible path back to fiscal health — and the bond market could see it.
Growth. President Reagan’s supply-side tax cuts boosted economic growth, which grew the tax base.
Restraint. Reagan increased defense spending but held the line on most everything else.
The peace dividend. That defense buildup helped end the Cold War. When the Berlin Wall fell, the U.S. collected a “peace dividend” — defense spending fell sharply as a share of the economy.
Bipartisan deals. President Clinton and Speaker Newt Gingrich brokered deals that reined in spending further, including welfare reform (“ending welfare as we know it”).
The result was four straight budget surpluses from 1998 to 2001, and net interest settled into a comfortable range of 1–2% of GDP for roughly 25 years. Falling interest costs and falling interest rates fed on each other — a virtuous cycle.
In the 1990s the bond market could see a path to fiscal health. Today it’s looking for one — and not finding it.
Why This Time Is Harder
We think the problem today is considerably worse than it was 35 years ago, and the odds of getting interest costs back down to 1–2% of GDP are much slimmer. Consider how the starting point has changed:
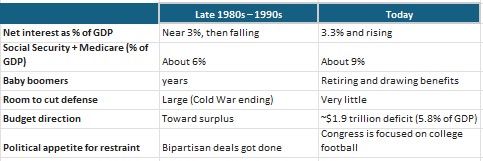
Sources: Congressional Budget Office (Budget and Economic Outlook 2026–2036), Historical figures approximate.
Entitlements have grown by roughly three percentage points of GDP, and military spending can’t realistically go much lower in today’s world. There is no peace dividend waiting in the wings.
And here is the part that gets almost no attention: the Congressional Budget Office’s own forecast — the one showing interest doubling to $2.1 trillion (4.6% of GDP) by 2036 — assumed the 10-year Treasury would sit around 4.1% to 4.3%. We are at 5.2% today. If rates stay anywhere near current levels, the official projections are too optimistic.
Think of it like a family that bought their house with a 3% mortgage and now has to refinance a piece of it every year at 5%. Nothing changes overnight. But every year, more of the paycheck goes to the bank. Roughly speaking, with about $31 trillion of debt held by the public, every one-percentage-point increase in average borrowing costs eventually adds around $300 billion a year to the interest bill once the debt rolls over.
The Competition for Every Dollar of Savings
There is a second, quieter reason long-term yields are climbing: there simply isn’t enough savings to go around.
Americans are saving just 2.7% of their disposable income — less than the 3.3% of GDP the government is now spending on interest alone. At the same time, Washington needs to finance roughly $2 trillion a year in deficits, and corporate America wants to fund something like $1 trillion in AI datacenter construction. Both are fishing in the same pond. When demand for capital outruns the supply of savings, the price of money — interest rates — goes up. Even Chairman Warsh cited “competition for capital” as a driver of higher yields.
Four Ways This Could Play Out — and Who Decides
Here is how we’re weighing the possibilities over the next 12 to 24 months:
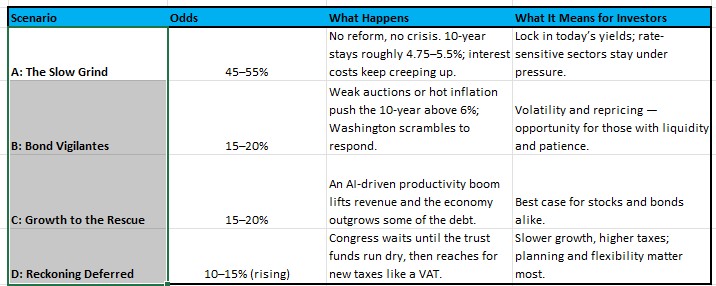
Probabilities reflect the subjective judgment not backed by any other authority.
Notice that none of these outcomes is decided by the Fed or the bond market. They’re decided at the ballot box. The midterm elections are five weeks away, and 2028 follows close behind. Who controls Congress and the White House will shape spending, taxes, and entitlement policy more than any Fed meeting — and that means voters, not markets, hold the most influence over which scenario we get.
That’s also where the biggest risk lies. Not in any single party, but in a political system where neither side is held accountable for the debt. Deficits run over $1.8 trillion no matter who is in charge. Promising benefits and tax cuts wins elections; asking for restraint doesn’t. Until voters reward the politicians willing to tell the truth about entitlements — and punish the ones who won’t — Scenario A is the default, and Scenario D gets a little more likely every year.
The biggest risk to the bond market isn’t the Fed. It’s a Congress that is never held accountable for the bill.
The Best Path — and Our Biggest Fear
The best path for Washington is to continue the downward pressure the Trump Administration has put on domestic discretionary spending. That helps. But discretionary spending isn’t where the growth is. The budget cries out for entitlement reform, and Congress appears unable, unwilling, or simply unconcerned about acting.
Our biggest fear is that waiting too long turns a spending problem into a tax problem. If entitlements aren’t addressed while there is still time to phase in changes gradually, a large new tax — like a VAT — goes from unthinkable to likely. To be fair, even Reagan signed several tax increases into law. But when he left office, the top marginal income tax rate had fallen from 70% to 28%. The direction of travel mattered. Today, we can’t say with confidence which direction we’re traveling.
What This Means for Our Clients
A fiscal problem in Washington is not automatically a portfolio problem for you — if you plan for it. Here is how we are thinking about it:
Income is back. For the first time in almost 20 years, high-quality bonds pay a real return. For income-focused investors, today’s yields are an opportunity, not just a headline.
Respect duration. We remain selective about how far out on the maturity curve we lend. The long end carries the most fiscal risk.
Balance sheets matter. Companies that depend on cheap refinancing are vulnerable. Businesses with strong cash flow and low debt can self-fund while competitors pay up.
Plan for tax uncertainty. If Scenario D is even partly right, the tax code you plan around today may not be the one you retire under. Flexibility — across account types and income sources — has real value.
Don’t let fear make the decision. Today’s rates are historically normal, and headlines about “debt crises” are designed to scare. Reacting emotionally to them is usually more costly than the problem itself.
The Bottom Line
We aren’t predicting Armageddon any time soon. The U.S. still borrows in its own currency, still has the deepest capital markets in the world, and still has the most dynamic economy on the planet. But one way or another, our debt burden is pushing steadily toward a breaking point — and the bond market has started to say so out loud.
The media’s attention is elsewhere. Ours is not.
The Week Ahead
Investors will have a relatively light economic calendar to digest next week, with attention concentrated on two important inflation and labor-market reports. Wednesday’s PCE report, which financial market commentators seemingly can’t reference without stating is “The Fed’s preferred inflation gauge” because it accounts for goods substitution rather than focusing on a fixed basket, will provide another look at whether price pressures are easing toward the stated 2% target or remaining stubbornly above it. A hotter-than-expected reading would reinforce the recent sharp rise in Treasury yields, while a softer report could reduce market expectations that the terminal rate of this hiking cycle is a full 100 basis points higher than it currently is. While the market’s focus is much more heavily weighted toward inflation expectations, the most important report concerning the other half of the Fed’s dual mandate arrives Friday with the release of the U.S. unemployment report, which is expected to show a continued healthy labor market with job growth of 100k while the unemployment rate holds steady at 4.1%. The Iranian situation remains a wildcard and the main geopolitical driver of energy prices.